Where’s Wind Power During NW Heat Wave? Nonexistent
The temps have been miserable, thank goodness for air conditioning (for most!)
Wind power is virtually non-existent during our heat wave
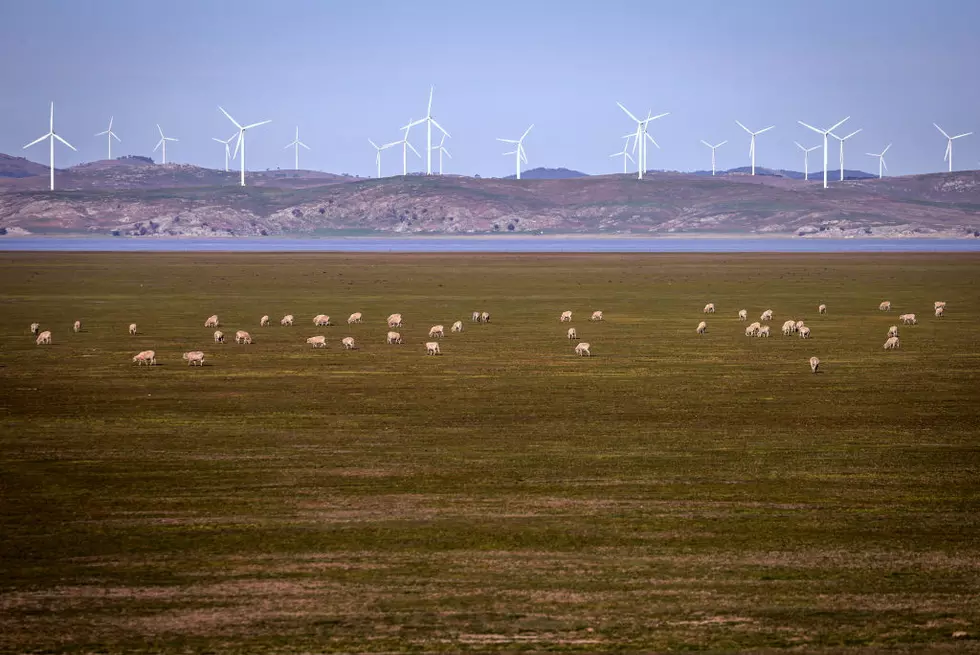
The Mid-Columbia group Save Our Ridges on Facebook is a large contingent of Tri-City residents opposed to the Scout Energy Horse Heaven Hills wind farm, which would tattoo up to 240 massive turbines along a 24-mile stretch of the Horse Heaven Hills, beginning near Finley.
They shared some eye-opening information that came from Todd Meyers of the Washington Policy Center. Meyers is their Environmental Director.

Get our free mobile app
He posted this on his page on Wednesday, concerning our heat wave, and the role that wind power has (not) played:
"The last three days have been the hottest of the year and wind power across the NW has fallen to nearly zero.
The chart below shows energy sources and demand (in red). Note the green line at the bottom, which is basically wind. For the last three days, it has been near zero, except last night when it kicked up a bit, exactly when demand was low and we didn't need the electricity.
During peak demand hours in the evening, however, it falls to almost nothing - precisely when we need it. Wind can be part of our energy supply, but it cannot replace reliable sources of energy like hydro."
His post was accompanied by this graph from the Bonneville Power Administration, showing energy demand, and which resources supplying it. As he noted the green line in the graph represents wind power.

This data is not just confined to the Mid-Columbia, this is a Pacific NW view of our general heatwave, and includes multiple regions served by the BPA.
Research shows there is evidence that heat domes can cause high pressure, which keeps wind from blowing and air circulating. That would explain why we've seen virtually no wind the last few days.
Wonder if the Scout Energy folks have seen this?
LOOK: The most extreme temperatures in the history of every state
Stacker consulted 2021 data from the NOAA's State Climate Extremes Committee (SCEC) to illustrate the hottest and coldest temperatures ever recorded in each state. Each slide also reveals the all-time highest 24-hour precipitation record and all-time highest 24-hour snowfall.
Keep reading to find out individual state records in alphabetical order.
Gallery Credit: Anuradha Varanasi
More From 610 KONA